A decade of Repairability Scores
After playing around with APIs in the last few weeks, I stumbled upon the iFixit API. With France’s repairability rating law taking effect in January 2020 - iFixit’s assessment of the assessment - and the recently released Framework Laptop providing an exciting novel approach to laptop repairability, it seems like the perfect time to look a little bit more closely at the iFixit repairability scores of the last years.
Getting the Data
While the iFixit API is well documented, getting the repairability scores is not as straightforward as one might think. There are specific pages on the iFixit page dedicated to Tablet, Smartphone and Laptop repairability scores. However, the data on these pages is not readily available via the API and does not seem to be updated automatically as some of the most recent teardowns are missing.
So we are going with an approach by an early iFixit employee from 2013: Using the externally-available API to automatically parse the repairability scores. Their Github repositiory goes through all Teardowns/Guides and looks for a score in the last step which is a reasonable assumption.
Since 2013, the number of Teardowns has grown to over 1,000 if you include both iFixit and User-generated content. Furthermore, the original Python wrapper pyfixit was stuck on Python 2.x and the updated wrapper pyfixit2 did not install correctly using pip, so I figured that using the Full-site search API to look for the term ‘Repairability’ in Teardowns is the easiest way to start.
Filtering user-generated and non-english content the 426 results left 399 teardowns. Additionally there were some false positives, jokes like the Orange Teardown and teardowns that mentioned repairability without giving a repairability score, such as the Pebble smartwatch: “We don’t have a repairability metric for a watch … yet.”. At the end, 381 teardowns with ratings remained.
What Devices did iFixit tear down?
Let’s look at the devices by type and year. The iFixit API provides a ‘category’ property, but unfortunately this tells us only something about the device itself, not which device type it belongs to. Therefore, these categories were assigned manually.
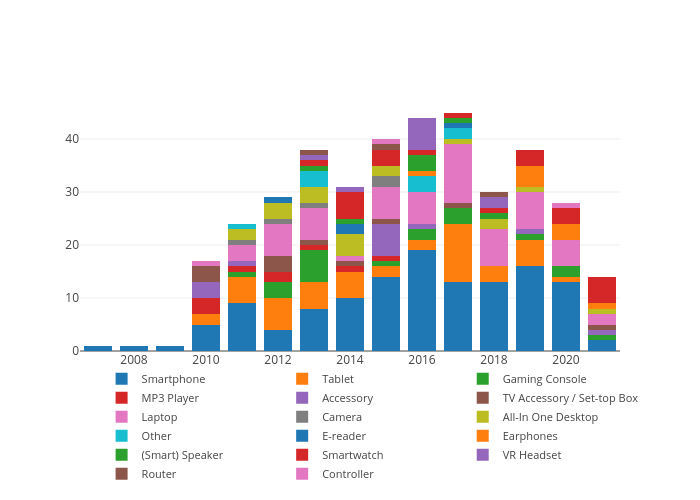
From 2007 to 2009, only one device was torn down each year: the first three generations of the iPhone. After that, both the amount and variety of devices expands: MP3 Players, Tablets, Laptops, All in One Desktop Computers, Gaming Consoles, Accessories. With 54 teardowns, which comes down to more than one per week, 2017 is the high point in volume.
The five main device types account for 279 out of the 381 devices (73,23%):
| Type | Entries | Percentage |
|---|---|---|
| Smartphone | 129 | 33.86% |
| Laptop | 61 | 16.01% |
| Tablet | 47 | 12.34% |
| Smartwatch | 22 | 5.77% |
| Gaming Console | 20 | 5.25% |
Unsurprisingly, the three devices with their own dedicated repairability score page make up most of the field with Smartphones being way ahead of every other device type by far. The fourth place, however, is a device type that was only introduced in 2014: the Smartwatch. While the remaining device types may not be as numerous, it is great to see the breadth of devices explored with the teardowns.
What is the most popular iFixit teardown of all time?
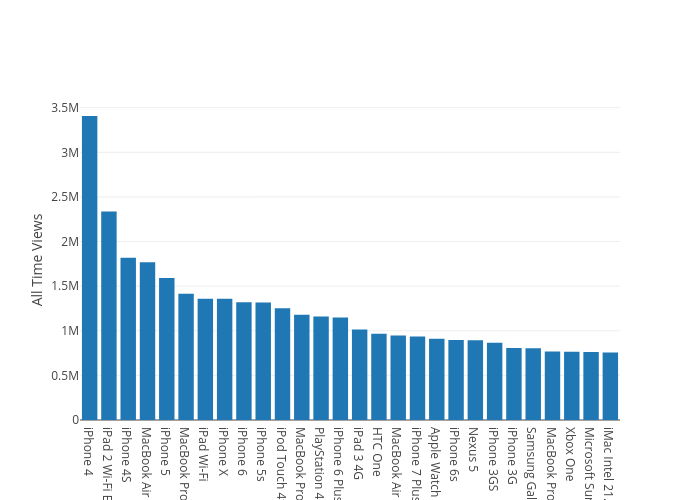
Going by All Time Views, teardowns of Apple devices are clearly the most popular. You have to go all the way to number 13 to get the first non-Apple device: the PlayStation 4. The teardown of the iPhone 4, which was the first major design change for the iPhone, had reached a staggering 3.4 million views at the time of scraping. iFixit provides page view statistics right on the page itself, but unfortunately, the data is not included in the API.
Is there a trend in Repairability Scores (over time)?
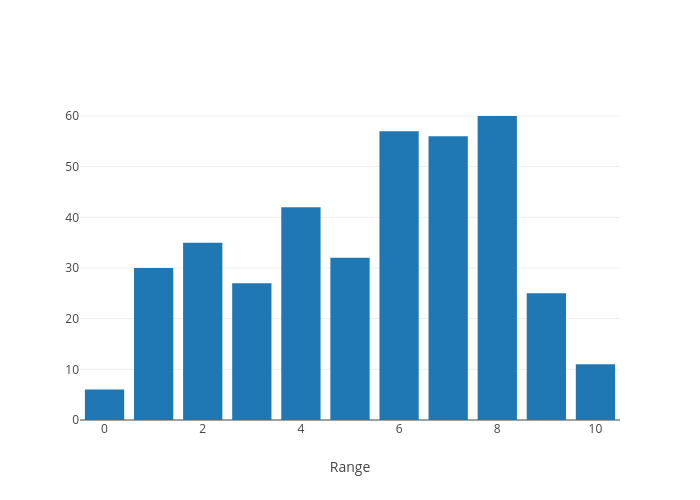
The histogram of Repairability Scores is skewed left. Overall, most devices receiving a Repairability Score seem to be at least decently servicable. Scores of 9 and 10 are rare, the same is true for the lowest score 0. Still, there is something missing here: the temporal dimension.
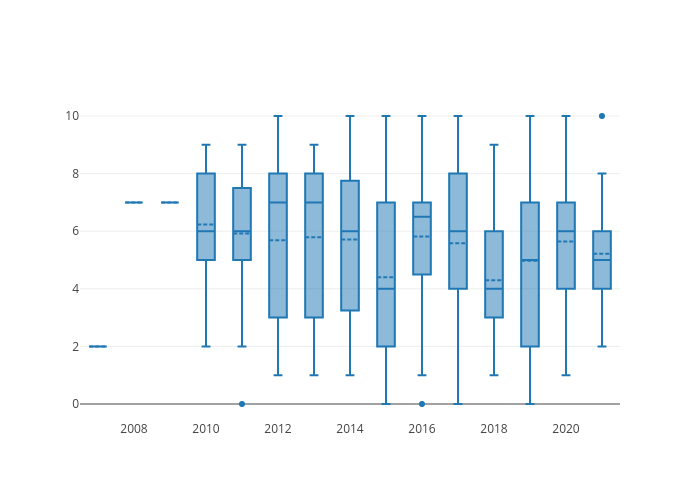
A look at the variability over time gives a chronological view on Repairability Scores. The iPad 2 Smart Cover is the first teardown with a Repairability Score of 0 in 2011. In 2012, the HP Z1, an All-In One PC, gets the first Repairability Score of 10.
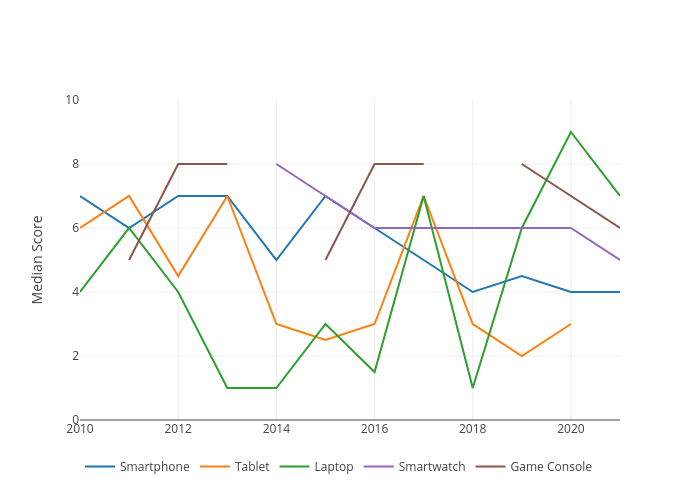
The variance is especially high in 2012, 2013, 2015 and 2019. The highest median Repairability Score is 7 (2012, 2013), the lowest median Repairability Score is 4 (2015, 2018). While the median is not plummeting and 2016 comes close to the median Repairability Score of 2012 & 2013, this depiction is a bit more muted than the initial impression from the histogram.
So, what distinguishes 2012 and 2013 from 2015 and 2018?
In 2012, the median Laptop Repairability Score is lower compared to the year before (2011: 6, 2012: 4), mainly due to the poor rating of the Retina MacBook Pros and the Microsoft Surface, with the Tablet category faring not much better (2011: 7, 2012: 4,5). The push upwards comes from device types like Gaming Console, All-in-One PC and Smartphone. The situation is similar in 2013, though the Tablet Repairability Scores are improved this time around (Median: 7) while Laptops perform even worse (Median: 1). In 2013, only MacBooks and Surface Laptops are represented in the category. While teardowns of Apple devices are certainly popular, they hardly conclude with great Repairability Scores.
In 2015 and 2018, both categories perform poorly (Median Laptop: 2015: 3, 2018: 1; Median Tablet: 2015: 2.5, 2018: 3) with the Smartphone category joining them in the sub-5 zone in 2018 (Median: 4). In 2015, other categories perform subpar as well: Accessories like the Apple Pencil, the Magic Mouse or the Magic Keyboard receive bad Repairability Scores and in 2018 the categories Laptop, Tablet and Smartphone make up 76.6% of all devices receiving a score in that year which heavily influences the overall median Repairability Score.
While the Laptop category has improved since 2018 with the median going up to 9 in 2020 and 7 in 2021, Tablets seem as repair-resistant as ever (Median 2019: 2, 2020: 3). Smartphone Repairability Scores seem to be on a downturn since 2015, settling in on a 4 out of 10.
Repairability has certainly had a tough stand in the design process of manufacturers over the last decade as devices got more complex, but a peek into repairability scores shows that there are positive trends in the last few years. Let’s hope they continue!
Two small addenda: In a few categories like Smartwatches and Laptops, most of the devices are built by Apple, so it may be interesting to see how repairability looks across companies. Furthermore, a note in the “ifixit-repairability-scores” repository by James Pearson Hughes suggests that guidelines for the scoring process were established in 2013 or later to make the scoring more consistent. I don’t know if or when these guidelines took effect and whether they led to score changes in older teardowns.

Manuel Häußermann
I'm interested in the intersections between Literature, Culture and the Digital.